Climate Indices with Earthkit & Xclim
This notebook demonstrates how to compute and visualize climate indices from CMIP6 datasets using the earthkit-climate and xclim packages.
We’ll use:
Precipitation-based indices:
SDII: Simple Daily Intensity Index (average precipitation on wet days)
CWD: Consecutive Wet Days (max number of wet days in a row)
Temperature-based indices:
DTR: Daily Temperature Range (Tmax - Tmin)
WSDI: Warm Spell Duration Index (≥6 consecutive days above 90th percentile)
HDD: Heating Degree Days (based on temperature below threshold)
We’ll load ACCESS-CM2 CMIP6 data for both historical and SSP585 scenarios.
[36]:
import warnings

import cartopy.crs as ccrs
import earthkit.data as ekd
import earthkit.plots as ekp
import matplotlib.pyplot as plt

from earthkit.climate.indicators.precipitation import daily_precipitation_intensity, maximum_consecutive_wet_days
from earthkit.climate.indicators.temperature import (
    daily_temperature_range,
    heating_degree_days,
    warm_spell_duration_index,
)
from earthkit.climate.utils.percentile import calculate_percentile_doy

warnings.filterwarnings("ignore")

plt.rcParams["figure.figsize"] = (8, 5)
Loading CMIP6 data
We’ll use daily gridded data from the ACCESS-CM2 model for precipitation (pr), maximum (tasmax) and minimum (tasmin) temperature, for both historical and SSP585 future scenarios.
[2]:
# Load precipitation
pr_hist = ekd.from_source(
    "url",
    "https://sites.ecmwf.int/repository/earthkit-climate/pr_gridded_day_CMIP6_ACCESS-CM2_r1i1p1f1_deepESD_day_historical.nc",
)
pr_ssp585 = ekd.from_source(
    "url",
    "https://sites.ecmwf.int/repository/earthkit-climate/pr_gridded_day_CMIP6_ACCESS-CM2_r1i1p1f1_deepESD_day_ssp585.nc",
)

# Load temperature
tasmin_hist = ekd.from_source(
    "url",
    "https://sites.ecmwf.int/repository/earthkit-climate/tasmin_gridded_day_CMIP6_ACCESS-CM2_r1i1p1f1_deepESD_day_historical.nc",
)
tasmin_ssp585 = ekd.from_source(
    "url",
    "https://sites.ecmwf.int/repository/earthkit-climate/tasmin_gridded_day_CMIP6_ACCESS-CM2_r1i1p1f1_deepESD_day_ssp585.nc",
)

tasmax_hist = ekd.from_source(
    "url",
    "https://sites.ecmwf.int/repository/earthkit-climate/tasmax_gridded_day_CMIP6_ACCESS-CM2_r1i1p1f1_deepESD_day_historical.nc",
)
tasmax_ssp585 = ekd.from_source(
    "url",
    "https://sites.ecmwf.int/repository/earthkit-climate/tasmax_gridded_day_CMIP6_ACCESS-CM2_r1i1p1f1_deepESD_day_ssp585.nc",
)
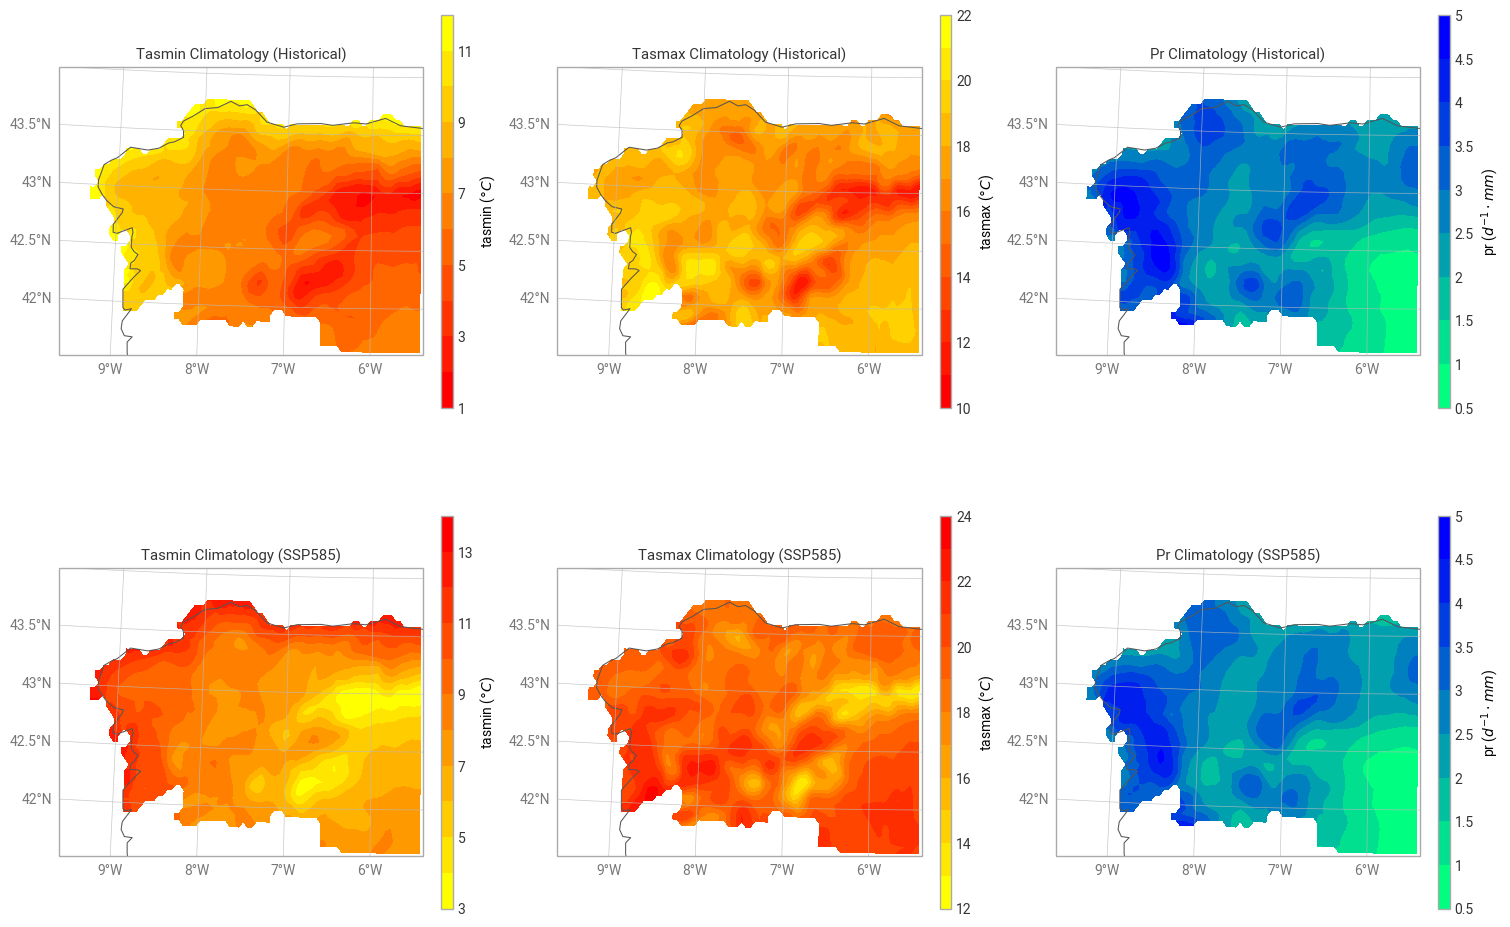
Inspect and visualize the raw data
Before computing indices, let’s plot a few example grids to see how the raw variables look.
[3]:
# Define domain (Spain north coast)
domain = [-9.6, -5.4, 41.6, 44.0]

# Create the figure with 2x2 maps
figure = ekp.Figure(
    crs=ccrs.NearsidePerspective(central_longitude=-5, central_latitude=43), rows=2, columns=3, size=(15, 10)
)

# Define variables and their datasets
variables = {
    "tasmin": (tasmin_hist, tasmin_ssp585, "celsius"),
    "tasmax": (tasmax_hist, tasmax_ssp585, "celsius"),
    "pr": (pr_hist, pr_ssp585, "mm/day"),
}

# HISTORICAL (row 0)
for col, (var, (hist, ssp, units)) in enumerate(variables.items()):
    hist_clim = hist.to_xarray().mean("time")
    cmap = "winter_r" if var == "pr" else "autumn"
    style = ekp.styles.Style(colors=cmap, units=units)
    map_plot = figure.add_map(row=0, column=col, domain=domain)
    map_plot.quickplot(hist_clim, style=style)
    map_plot.coastlines()
    map_plot.gridlines()
    map_plot.legend(location="right")
    map_plot.title(f"{var} Climatology (Historical)")

# SSP585 (row 1)
for col, (var, (hist, ssp, units)) in enumerate(variables.items()):
    ssp_clim = ssp.to_xarray().mean("time")
    cmap = "winter_r" if var == "pr" else "autumn_r"
    style = ekp.styles.Style(colors=cmap, units=units)
    map_plot = figure.add_map(row=1, column=col, domain=domain)
    map_plot.quickplot(ssp_clim, style=style)
    map_plot.coastlines()
    map_plot.gridlines()
    map_plot.legend(location="right")
    map_plot.title(f"{var} Climatology (SSP585)")

# Final layout
figure.show()
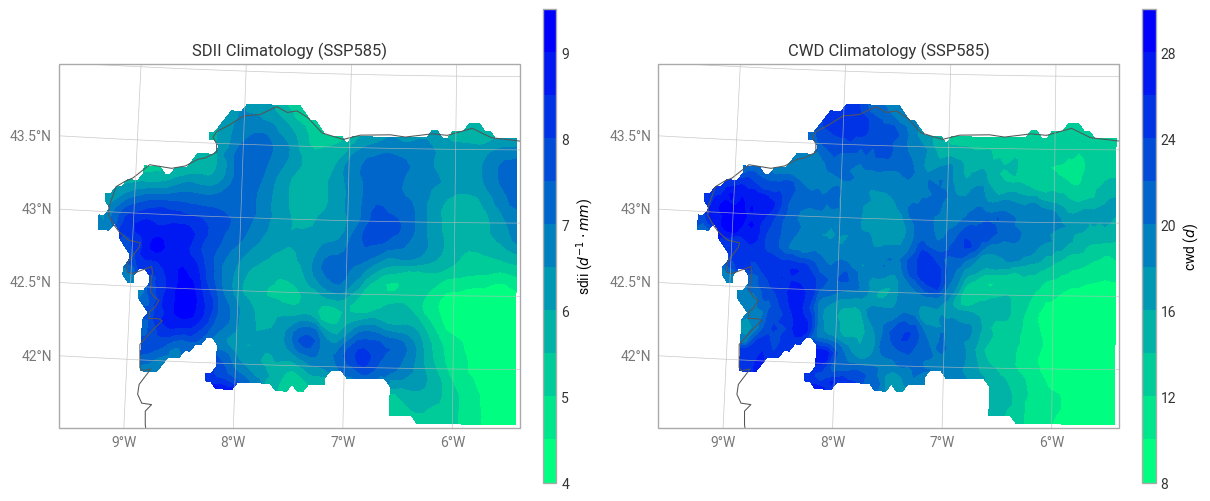
Precipitation-based indices
We’ll compute:
SDII – Simple Daily Intensity Index (average rain on wet days)
CWD – Consecutive Wet Days (max length of a wet period)
[31]:
# SDII
sdii = daily_precipitation_intensity(pr_ssp585, thresh="1 mm/day", freq="YS")

# CWD
cwd = maximum_consecutive_wet_days(pr_ssp585, thresh="1 mm/day")
Inspecting the computed precipitation indices
Now that we’ve calculated the precipitation-based indices (SDII and CWD), let’s take a closer look at their structure and metadata.
We’ll explore:
The list of fields available in each index object (
.ls()).The associated provenance and processing metadata (
.metadata()).The attributes of the resulting
xarray.Dataset(.to_xarray().attrs).
This helps confirm that the computations ran correctly and to understand what information Earthkit keeps about each field.
[27]:
# Inspect the SDII object (Simple Daily Intensity Index)
print("SDII fields:")
print(sdii.ls())

print("\nSDII metadata:")
print(sdii.metadata()[0])  # show first metadata entry

print("\nSDII xarray attributes:")
print(sdii.to_xarray().attrs)
SDII fields:
   variable level       valid_datetime   units
0      sdii  None  2015-01-01T00:00:00  mm d-1
1      sdii  None  2016-01-01T00:00:00  mm d-1
2      sdii  None  2017-01-01T00:00:00  mm d-1
3      sdii  None  2018-01-01T00:00:00  mm d-1
4      sdii  None  2019-01-01T00:00:00  mm d-1
5      sdii  None  2020-01-01T00:00:00  mm d-1
6      sdii  None  2021-01-01T00:00:00  mm d-1
7      sdii  None  2022-01-01T00:00:00  mm d-1
8      sdii  None  2023-01-01T00:00:00  mm d-1
9      sdii  None  2024-01-01T00:00:00  mm d-1
10     sdii  None  2025-01-01T00:00:00  mm d-1
11     sdii  None  2026-01-01T00:00:00  mm d-1
12     sdii  None  2027-01-01T00:00:00  mm d-1
13     sdii  None  2028-01-01T00:00:00  mm d-1
14     sdii  None  2029-01-01T00:00:00  mm d-1
15     sdii  None  2030-01-01T00:00:00  mm d-1
16     sdii  None  2031-01-01T00:00:00  mm d-1
17     sdii  None  2032-01-01T00:00:00  mm d-1
18     sdii  None  2033-01-01T00:00:00  mm d-1
19     sdii  None  2034-01-01T00:00:00  mm d-1
20     sdii  None  2035-01-01T00:00:00  mm d-1
21     sdii  None  2036-01-01T00:00:00  mm d-1
22     sdii  None  2037-01-01T00:00:00  mm d-1
23     sdii  None  2038-01-01T00:00:00  mm d-1
24     sdii  None  2039-01-01T00:00:00  mm d-1
25     sdii  None  2040-01-01T00:00:00  mm d-1
26     sdii  None  2041-01-01T00:00:00  mm d-1
27     sdii  None  2042-01-01T00:00:00  mm d-1
28     sdii  None  2043-01-01T00:00:00  mm d-1
29     sdii  None  2044-01-01T00:00:00  mm d-1
30     sdii  None  2045-01-01T00:00:00  mm d-1
31     sdii  None  2046-01-01T00:00:00  mm d-1
32     sdii  None  2047-01-01T00:00:00  mm d-1
33     sdii  None  2048-01-01T00:00:00  mm d-1
34     sdii  None  2049-01-01T00:00:00  mm d-1
35     sdii  None  2050-01-01T00:00:00  mm d-1
36     sdii  None  2051-01-01T00:00:00  mm d-1
37     sdii  None  2052-01-01T00:00:00  mm d-1
38     sdii  None  2053-01-01T00:00:00  mm d-1
39     sdii  None  2054-01-01T00:00:00  mm d-1

SDII metadata:
XArrayMetadata({'units': 'mm d-1', 'cell_methods': '', 'history': "[2025-12-01 22:46:06] sdii: SDII(pr=pr, thresh='1 mm/day', freq='YS', op='>=') with options check_missing=any - xclim version: 0.59.1\n", 'standard_name': 'lwe_thickness_of_precipitation_amount', 'long_name': 'Average precipitation during days with daily precipitation over 1 mm/day (simple daily intensity index: sdii)', 'description': 'Annual simple daily intensity index (sdii) or annual average precipitation for days with daily precipitation over 1 mm/day.', 'date': 20150101, 'time': 0, 'variable': 'sdii', 'level': None, 'levtype': 'sfc'})

SDII xarray attributes:
{'earthkit_provenance': {'earthkit_internal': {'input_type': 'earthkit.data.readers.netcdf.NetCDFFieldListReader'}, 'indicator_definition': {'pr': Parameter(kind=<InputKind.VARIABLE: 0>, default='pr', compute_name='pr', description='Daily precipitation.', units='[precipitation]', choices=<class 'xclim.core.indicator._empty'>, value=<class 'xclim.core.indicator._empty'>), 'thresh': Parameter(kind=<InputKind.QUANTIFIED: 2>, default='1 mm/day', compute_name='thresh', description='Precipitation value over which a day is considered wet.', units='[precipitation]', choices=<class 'xclim.core.indicator._empty'>, value=<class 'xclim.core.indicator._empty'>), 'freq': Parameter(kind=<InputKind.FREQ_STR: 3>, default='YS', compute_name='freq', description='Resampling frequency.', units=<class 'xclim.core.indicator._empty'>, choices=<class 'xclim.core.indicator._empty'>, value=<class 'xclim.core.indicator._empty'>), 'op': Parameter(kind=<InputKind.STRING: 5>, default='>=', compute_name='op', description='Comparison operation. Default: ">=".', units=<class 'xclim.core.indicator._empty'>, choices={'>', '>=', 'ge', 'gt'}, value=<class 'xclim.core.indicator._empty'>), 'ds': Parameter(kind=<InputKind.DATASET: 70>, default=None, compute_name=<class 'xclim.core.indicator._empty'>, description='A dataset with the variables given by name.', units=<class 'xclim.core.indicator._empty'>, choices=<class 'xclim.core.indicator._empty'>, value=<class 'xclim.core.indicator._empty'>), 'indexer': Parameter(kind=<InputKind.KWARGS: 50>, default=<class 'inspect._empty'>, compute_name=<class 'xclim.core.indicator._empty'>, description='Indexing parameters to compute the indicator on a temporal subset of the data. It accepts the same arguments as :py:func:`xclim.indices.generic.select_time`.', units=<class 'xclim.core.indicator._empty'>, choices=<class 'xclim.core.indicator._empty'>, value=<class 'xclim.core.indicator._empty'>)}, 'cf_attrs': [{'standard_name': 'lwe_thickness_of_precipitation_amount', 'long_name': 'Average precipitation during days with daily precipitation over {thresh} (Simple Daily Intensity Index: SDII)', 'units': 'mm d-1', 'description': '{freq} Simple Daily Intensity Index (SDII) or {freq} average precipitation for days with daily precipitation over {thresh}.', 'var_name': 'sdii'}], 'call_info': {'xclim_function': 'daily_pr_intensity', 'parameters': {'pr': 'pr', 'thresh': '1 mm/day', 'freq': 'YS', 'op': '>=', 'ds': <xarray.Dataset> Size: 236MB
Dimensions:  (time: 14610, lat: 48, lon: 84)
Coordinates:
  * time     (time) datetime64[ns] 117kB 2015-01-01 2015-01-02 ... 2054-12-31
  * lat      (lat) float64 384B 41.62 41.67 41.72 41.77 ... 43.87 43.92 43.97
  * lon      (lon) float64 672B -9.575 -9.525 -9.475 ... -5.525 -5.475 -5.425
    height   float64 8B ...
Data variables:
    pr       (time, lat, lon) float32 236MB dask.array<chunksize=(4870, 16, 28), meta=np.ndarray>
Attributes:
    CDI:             Climate Data Interface version 2.4.4 (https://mpimet.mpg...
    Conventions:     CF-1.6
    history:         Fri Mar 21 11:42:19 2025: cdo splityear ACCESS-CM2_ssp58...
    CDO:             Climate Data Operators version 2.4.4 (https://mpimet.mpg...
    model:           ACCESS-CM2_r1i1p1f1_deepESD
    scenario:        ssp585
    project_format:  gridded
    project_name:    cmip6
    project_type:    projections, 'indexer': {}}}}}
Notes on SDII metadata
The metadata includes details such as the processing history, indicator name, variable units, and temporal frequency.
earthkit-climateattaches provenance automatically through its integration withxclim, ensuring full traceability.You can also explore the
sdii.to_xarray()object directly to see the data variables and dimensions.
[28]:
# Inspect the CWD object (Maximum Consecutive Wet Days)
print("CWD fields:")
print(cwd.ls())

print("\nCWD metadata:")
print(cwd.metadata()[0])

print("\nCWD xarray attributes:")
print(cwd.to_xarray().attrs)
CWD fields:
   variable level       valid_datetime units
0       cwd  None  2015-01-01T00:00:00  days
1       cwd  None  2016-01-01T00:00:00  days
2       cwd  None  2017-01-01T00:00:00  days
3       cwd  None  2018-01-01T00:00:00  days
4       cwd  None  2019-01-01T00:00:00  days
5       cwd  None  2020-01-01T00:00:00  days
6       cwd  None  2021-01-01T00:00:00  days
7       cwd  None  2022-01-01T00:00:00  days
8       cwd  None  2023-01-01T00:00:00  days
9       cwd  None  2024-01-01T00:00:00  days
10      cwd  None  2025-01-01T00:00:00  days
11      cwd  None  2026-01-01T00:00:00  days
12      cwd  None  2027-01-01T00:00:00  days
13      cwd  None  2028-01-01T00:00:00  days
14      cwd  None  2029-01-01T00:00:00  days
15      cwd  None  2030-01-01T00:00:00  days
16      cwd  None  2031-01-01T00:00:00  days
17      cwd  None  2032-01-01T00:00:00  days
18      cwd  None  2033-01-01T00:00:00  days
19      cwd  None  2034-01-01T00:00:00  days
20      cwd  None  2035-01-01T00:00:00  days
21      cwd  None  2036-01-01T00:00:00  days
22      cwd  None  2037-01-01T00:00:00  days
23      cwd  None  2038-01-01T00:00:00  days
24      cwd  None  2039-01-01T00:00:00  days
25      cwd  None  2040-01-01T00:00:00  days
26      cwd  None  2041-01-01T00:00:00  days
27      cwd  None  2042-01-01T00:00:00  days
28      cwd  None  2043-01-01T00:00:00  days
29      cwd  None  2044-01-01T00:00:00  days
30      cwd  None  2045-01-01T00:00:00  days
31      cwd  None  2046-01-01T00:00:00  days
32      cwd  None  2047-01-01T00:00:00  days
33      cwd  None  2048-01-01T00:00:00  days
34      cwd  None  2049-01-01T00:00:00  days
35      cwd  None  2050-01-01T00:00:00  days
36      cwd  None  2051-01-01T00:00:00  days
37      cwd  None  2052-01-01T00:00:00  days
38      cwd  None  2053-01-01T00:00:00  days
39      cwd  None  2054-01-01T00:00:00  days

CWD metadata:
XArrayMetadata({'units': 'days', 'cell_methods': ' time: sum over days', 'history': "[2025-12-01 22:46:10] cwd: CWD(pr=pr, thresh='1 mm/day', freq='YS', resample_before_rl=True) with options check_missing=any - xclim version: 0.59.1\n", 'standard_name': 'number_of_days_with_lwe_thickness_of_precipitation_amount_at_or_above_threshold', 'long_name': 'Maximum consecutive days with daily precipitation at or above 1 mm/day', 'description': 'Annual maximum number of consecutive days with daily precipitation at or above 1 mm/day.', 'date': 20150101, 'time': 0, 'variable': 'cwd', 'level': None, 'levtype': 'sfc'})

CWD xarray attributes:
{'earthkit_provenance': {'earthkit_internal': {'input_type': 'earthkit.data.readers.netcdf.NetCDFFieldListReader'}, 'indicator_definition': {'pr': Parameter(kind=<InputKind.VARIABLE: 0>, default='pr', compute_name='pr', description='Mean daily precipitation flux.', units='[precipitation]', choices=<class 'xclim.core.indicator._empty'>, value=<class 'xclim.core.indicator._empty'>), 'thresh': Parameter(kind=<InputKind.QUANTIFIED: 2>, default='1 mm/day', compute_name='thresh', description='Threshold precipitation on which to base evaluation.', units='[precipitation]', choices=<class 'xclim.core.indicator._empty'>, value=<class 'xclim.core.indicator._empty'>), 'freq': Parameter(kind=<InputKind.FREQ_STR: 3>, default='YS', compute_name='freq', description='Resampling frequency.', units=<class 'xclim.core.indicator._empty'>, choices=<class 'xclim.core.indicator._empty'>, value=<class 'xclim.core.indicator._empty'>), 'resample_before_rl': Parameter(kind=<InputKind.BOOL: 9>, default=True, compute_name='resample_before_rl', description='Determines if the resampling should take place before or after the run length encoding (or a similar algorithm) is applied to runs.', units=<class 'xclim.core.indicator._empty'>, choices=<class 'xclim.core.indicator._empty'>, value=<class 'xclim.core.indicator._empty'>), 'ds': Parameter(kind=<InputKind.DATASET: 70>, default=None, compute_name=<class 'xclim.core.indicator._empty'>, description='A dataset with the variables given by name.', units=<class 'xclim.core.indicator._empty'>, choices=<class 'xclim.core.indicator._empty'>, value=<class 'xclim.core.indicator._empty'>)}, 'cf_attrs': [{'standard_name': 'number_of_days_with_lwe_thickness_of_precipitation_amount_at_or_above_threshold', 'long_name': 'Maximum consecutive days with daily precipitation at or above {thresh}', 'units': 'days', 'cell_methods': 'time: sum over days', 'description': '{freq} maximum number of consecutive days with daily precipitation at or above {thresh}.', 'var_name': 'cwd'}], 'call_info': {'xclim_function': 'maximum_consecutive_wet_days', 'parameters': {'pr': 'pr', 'thresh': '1 mm/day', 'freq': 'YS', 'resample_before_rl': True, 'ds': <xarray.Dataset> Size: 236MB
Dimensions:  (time: 14610, lat: 48, lon: 84)
Coordinates:
  * time     (time) datetime64[ns] 117kB 2015-01-01 2015-01-02 ... 2054-12-31
  * lat      (lat) float64 384B 41.62 41.67 41.72 41.77 ... 43.87 43.92 43.97
  * lon      (lon) float64 672B -9.575 -9.525 -9.475 ... -5.525 -5.475 -5.425
    height   float64 8B ...
Data variables:
    pr       (time, lat, lon) float32 236MB dask.array<chunksize=(4870, 16, 28), meta=np.ndarray>
Attributes:
    CDI:             Climate Data Interface version 2.4.4 (https://mpimet.mpg...
    Conventions:     CF-1.6
    history:         Fri Mar 21 11:42:19 2025: cdo splityear ACCESS-CM2_ssp58...
    CDO:             Climate Data Operators version 2.4.4 (https://mpimet.mpg...
    model:           ACCESS-CM2_r1i1p1f1_deepESD
    scenario:        ssp585
    project_format:  gridded
    project_name:    cmip6
    project_type:    projections}}}}
Notes on CWD metadata
The CWD (Consecutive Wet Days) index records the longest sequence of wet days (above a threshold, typically 1 mm/day) per period.
Similar to SDII, it retains detailed provenance, so you know exactly which dataset, variable, and indicator were used.
These attributes are critical for reproducibility in climate data analysis.
[32]:
# Define domain (Spain north coast)
domain = [-9.6, -5.4, 41.6, 44.0]

# Create figure: 1 row (2 indices) × 2 scenarios (historical + ssp585)
figure = ekp.Figure(
    crs=ccrs.NearsidePerspective(central_longitude=-5, central_latitude=43), rows=1, columns=2, size=(12, 6)
)

# Define indices and corresponding datasets
indices = {"SDII": sdii, "CWD": cwd}

# Define color maps for each index
cmaps = {"SDII": "winter_r", "CWD": "winter_r"}

units = {"SDII": "mm/day", "CWD": "days"}

# PLOT: Each index climatology
for col, (name, index_obj) in enumerate(indices.items()):
    ds = index_obj.to_xarray().mean("time")
    cmap = cmaps[name]

    style = ekp.styles.Style(colors=cmap, units=units[name])
    map_plot = figure.add_map(row=0, column=col, domain=domain)
    map_plot.quickplot(ds, style=style)
    map_plot.coastlines()
    map_plot.gridlines()
    map_plot.title(f"{name} Climatology (SSP585)")
    map_plot.legend(location="right")

# Final layout
figure.show()
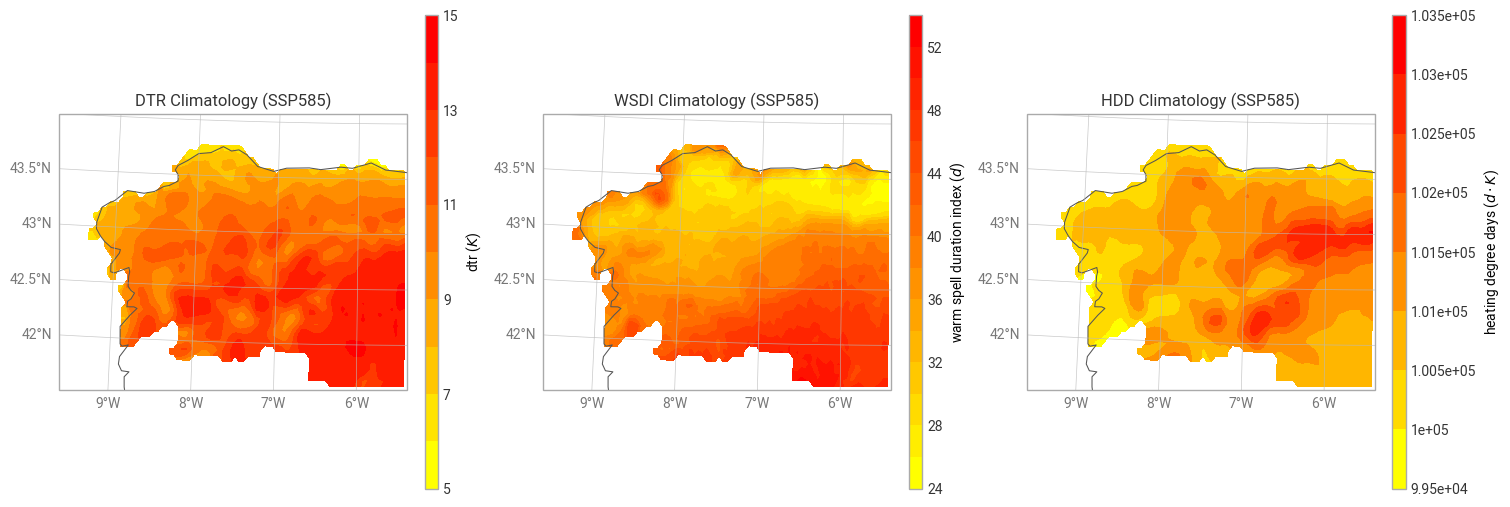
Temperature-based indices
Now we’ll compute:
DTR – Daily Temperature Range
WSDI – Warm Spell Duration Index (based on 90th percentile)
HDD – Heating Degree Days
[63]:
# DTR
dtr = daily_temperature_range(ds=(tasmax_ssp585 + tasmin_ssp585))

# WSDI (using historical baseline)
# Calculate 90th percentile from historical data
tasmax_per = calculate_percentile_doy(tasmax_hist.to_xarray(), variable="tasmax", percentile=90)

# Merge percentile with target dataset
ds_merged = tasmax_ssp585.to_xarray().merge(tasmax_per)

wsdi = warm_spell_duration_index(ds=ds_merged)

# HDD (approximation)
tas = (tasmax_ssp585.to_xarray()["tasmax"] + tasmin_ssp585.to_xarray()["tasmin"]) / 2
tas.attrs["units"] = "degC"
tas = tas.to_dataset(name="tas")
hdd = heating_degree_days(
    ds=ekd.from_source(
        "multi",
        ekd.from_object(tasmax_ssp585.to_xarray()),
        ekd.from_object(tasmin_ssp585.to_xarray()),
        ekd.from_object(tas),
    )
)
ekd.from_object(tas)## Inspecting the temperature-based indices
Now let’s explore the three temperature indices we calculated:
DTR (Daily Temperature Range) — Difference between daily maximum and minimum temperatures.
WSDI (Warm Spell Duration Index) — Number of warm spells: consecutive periods (≥6 days) above the 90th percentile of the historical period.
HDD (Heating Degree Days) — Heating degree days, estimating heating energy demand based on temperatures below a threshold.
For each index, we’ll check:
The available fields (
.ls()).The metadata and provenance (
.metadata()).The dataset attributes (
.to_xarray().attrs).
This helps us confirm that the results and units are consistent and properly documented.
[64]:
# DTR (Daily Temperature Range)
print("DTR fields:")
print(dtr.ls())

print("\n DTR metadata:")
print(dtr.metadata()[0])

print("\n DTR xarray attributes:")
print(dtr.to_xarray().attrs)
DTR fields:
   variable level       valid_datetime units
0       dtr  None  2015-01-01T00:00:00     K
1       dtr  None  2016-01-01T00:00:00     K
2       dtr  None  2017-01-01T00:00:00     K
3       dtr  None  2018-01-01T00:00:00     K
4       dtr  None  2019-01-01T00:00:00     K
5       dtr  None  2020-01-01T00:00:00     K
6       dtr  None  2021-01-01T00:00:00     K
7       dtr  None  2022-01-01T00:00:00     K
8       dtr  None  2023-01-01T00:00:00     K
9       dtr  None  2024-01-01T00:00:00     K
10      dtr  None  2025-01-01T00:00:00     K
11      dtr  None  2026-01-01T00:00:00     K
12      dtr  None  2027-01-01T00:00:00     K
13      dtr  None  2028-01-01T00:00:00     K
14      dtr  None  2029-01-01T00:00:00     K
15      dtr  None  2030-01-01T00:00:00     K
16      dtr  None  2031-01-01T00:00:00     K
17      dtr  None  2032-01-01T00:00:00     K
18      dtr  None  2033-01-01T00:00:00     K
19      dtr  None  2034-01-01T00:00:00     K
20      dtr  None  2035-01-01T00:00:00     K
21      dtr  None  2036-01-01T00:00:00     K
22      dtr  None  2037-01-01T00:00:00     K
23      dtr  None  2038-01-01T00:00:00     K
24      dtr  None  2039-01-01T00:00:00     K
25      dtr  None  2040-01-01T00:00:00     K
26      dtr  None  2041-01-01T00:00:00     K
27      dtr  None  2042-01-01T00:00:00     K
28      dtr  None  2043-01-01T00:00:00     K
29      dtr  None  2044-01-01T00:00:00     K
30      dtr  None  2045-01-01T00:00:00     K
31      dtr  None  2046-01-01T00:00:00     K
32      dtr  None  2047-01-01T00:00:00     K
33      dtr  None  2048-01-01T00:00:00     K
34      dtr  None  2049-01-01T00:00:00     K
35      dtr  None  2050-01-01T00:00:00     K
36      dtr  None  2051-01-01T00:00:00     K
37      dtr  None  2052-01-01T00:00:00     K
38      dtr  None  2053-01-01T00:00:00     K
39      dtr  None  2054-01-01T00:00:00     K

 DTR metadata:
XArrayMetadata({'units': 'K', 'units_metadata': 'temperature: difference', 'cell_methods': ' time range within days time: mean over days', 'history': "[2025-12-01 23:20:37] dtr: DTR(tasmin=tasmin, tasmax=tasmax, freq='YS') with options check_missing=any - xclim version: 0.59.1\ntasmin: \ntasmax: ", 'standard_name': 'air_temperature', 'long_name': 'Mean diurnal temperature range', 'description': 'Annual mean diurnal temperature range.', 'date': 20150101, 'time': 0, 'variable': 'dtr', 'level': None, 'levtype': 'sfc'})

 DTR xarray attributes:
{'earthkit_provenance': {'earthkit_internal': {'input_type': 'earthkit.data.readers.netcdf.fieldlist.NetCDFMultiFieldList'}, 'indicator_definition': {'tasmin': Parameter(kind=<InputKind.VARIABLE: 0>, default='tasmin', compute_name='tasmin', description='Minimum daily temperature.', units='[temperature]', choices=<class 'xclim.core.indicator._empty'>, value=<class 'xclim.core.indicator._empty'>), 'tasmax': Parameter(kind=<InputKind.VARIABLE: 0>, default='tasmax', compute_name='tasmax', description='Maximum daily temperature.', units='[temperature]', choices=<class 'xclim.core.indicator._empty'>, value=<class 'xclim.core.indicator._empty'>), 'freq': Parameter(kind=<InputKind.FREQ_STR: 3>, default='YS', compute_name='freq', description='Resampling frequency.', units=<class 'xclim.core.indicator._empty'>, choices=<class 'xclim.core.indicator._empty'>, value=<class 'xclim.core.indicator._empty'>), 'ds': Parameter(kind=<InputKind.DATASET: 70>, default=None, compute_name=<class 'xclim.core.indicator._empty'>, description='A dataset with the variables given by name.', units=<class 'xclim.core.indicator._empty'>, choices=<class 'xclim.core.indicator._empty'>, value=<class 'xclim.core.indicator._empty'>), 'indexer': Parameter(kind=<InputKind.KWARGS: 50>, default=<class 'inspect._empty'>, compute_name=<class 'xclim.core.indicator._empty'>, description='Indexing parameters to compute the indicator on a temporal subset of the data. It accepts the same arguments as :py:func:`xclim.indices.generic.select_time`.', units=<class 'xclim.core.indicator._empty'>, choices=<class 'xclim.core.indicator._empty'>, value=<class 'xclim.core.indicator._empty'>)}, 'cf_attrs': [{'standard_name': 'air_temperature', 'long_name': 'Mean diurnal temperature range', 'units': 'K', 'cell_methods': 'time range within days time: mean over days', 'description': '{freq} mean diurnal temperature range.', 'var_name': 'dtr'}], 'call_info': {'xclim_function': 'daily_temperature_range', 'parameters': {'tasmin': 'tasmin', 'tasmax': 'tasmax', 'freq': 'YS', 'ds': <xarray.Dataset> Size: 471MB
Dimensions:  (time: 14610, lat: 48, lon: 84)
Coordinates:
  * time     (time) datetime64[ns] 117kB 2015-01-01 2015-01-02 ... 2054-12-31
  * lat      (lat) float64 384B 41.62 41.67 41.72 41.77 ... 43.87 43.92 43.97
  * lon      (lon) float64 672B -9.575 -9.525 -9.475 ... -5.525 -5.475 -5.425
    height   float64 8B 2.0
Data variables:
    tasmax   (time, lat, lon) float32 236MB dask.array<chunksize=(4870, 16, 28), meta=np.ndarray>
    tasmin   (time, lat, lon) float32 236MB dask.array<chunksize=(4870, 16, 28), meta=np.ndarray>
Attributes:
    model:         ACCESS-CM2_r1i1p1f1_deepESD
    scenario:      ssp585
    project_name:  cmip6
    project_type:  projections, 'indexer': {}}}}}
Notes on DTR
Represents the daily temperature range, a key measure of local temperature variability.
The metadata contains information about the input variables (
tasmax,tasmin), their units, and the indicator method used.Always check that the output units (
degC) are correct and consistent with the inputs.
[65]:
# WSDI (Warm Spell Duration Index)
print("WSDI fields:")
wsdi.ls()

print("\n WSDI metadata:")
print(wsdi.metadata()[0])

print("\n WSDI xarray attributes:")
print(wsdi.to_xarray().attrs)
WSDI fields:

 WSDI metadata:
XArrayMetadata({'units': 'days', 'cell_methods': ' time: sum over days', 'history': "[2025-12-01 23:20:39] warm_spell_duration_index: WARM_SPELL_DURATION_INDEX(tasmax=tasmax, tasmax_per=tasmax_per, window=6, freq='YS', resample_before_rl=True, bootstrap=False, op='>') with options check_missing=any - xclim version: 0.59.1\ntasmax: \ntasmax_per: [2025-12-01 23:20:38] per: percentile_doy(arr=tasmax, window=6, per=90, alpha=0.3333333333333333, beta=0.3333333333333333, copy=True) - xclim version: 0.59.1\n", 'standard_name': 'number_of_days_with_air_temperature_above_threshold', 'long_name': 'Number of days with at least 6 consecutive days where the maximum daily temperature is above the [90]th percentile(s)', 'description': "Annual number of days with at least 6 consecutive days where the maximum daily temperature is above the [90]th percentile(s). a 6 day(s) window, centred on each calendar day in the ['1995-01-01', '2014-12-31'] period, is used to compute the [90]th percentile(s).", 'date': 20150101, 'time': 0, 'variable': 'warm_spell_duration_index', 'level': None, 'levtype': 'sfc'})

 WSDI xarray attributes:
{'earthkit_provenance': {'earthkit_internal': {'input_type': 'earthkit.data.readers.netcdf.NetCDFFieldListReader'}, 'indicator_definition': {'tasmax': Parameter(kind=<InputKind.VARIABLE: 0>, default='tasmax', compute_name='tasmax', description='Maximum daily temperature.', units='[temperature]', choices=<class 'xclim.core.indicator._empty'>, value=<class 'xclim.core.indicator._empty'>), 'tasmax_per': Parameter(kind=<InputKind.VARIABLE: 0>, default='tasmax_per', compute_name='tasmax_per', description='Percentile(s) of daily maximum temperature.', units='[temperature]', choices=<class 'xclim.core.indicator._empty'>, value=<class 'xclim.core.indicator._empty'>), 'window': Parameter(kind=<InputKind.NUMBER: 4>, default=6, compute_name='window', description='Minimum number of days with temperature above threshold to qualify as a warm spell.', units=<class 'xclim.core.indicator._empty'>, choices=<class 'xclim.core.indicator._empty'>, value=<class 'xclim.core.indicator._empty'>), 'freq': Parameter(kind=<InputKind.FREQ_STR: 3>, default='YS', compute_name='freq', description='Resampling frequency.', units=<class 'xclim.core.indicator._empty'>, choices=<class 'xclim.core.indicator._empty'>, value=<class 'xclim.core.indicator._empty'>), 'resample_before_rl': Parameter(kind=<InputKind.BOOL: 9>, default=True, compute_name='resample_before_rl', description='Determines if the resampling should take place before or after the run length encoding (or a similar algorithm) is applied to runs.', units=<class 'xclim.core.indicator._empty'>, choices=<class 'xclim.core.indicator._empty'>, value=<class 'xclim.core.indicator._empty'>), 'bootstrap': Parameter(kind=<InputKind.BOOL: 9>, default=False, compute_name='bootstrap', description='Flag to run bootstrapping of percentiles. Used by percentile_bootstrap decorator. Bootstrapping is only useful when the percentiles are computed on a part of the studied sample. This period, common to percentiles and the sample must be bootstrapped to avoid inhomogeneities with the rest of the time series. Do not enable bootstrap when there is no common period, otherwise it will provide the wrong results. Note that bootstrapping is computationally expensive.', units=<class 'xclim.core.indicator._empty'>, choices=<class 'xclim.core.indicator._empty'>, value=<class 'xclim.core.indicator._empty'>), 'op': Parameter(kind=<InputKind.STRING: 5>, default='>', compute_name='op', description='Comparison operation. Default: ">".', units=<class 'xclim.core.indicator._empty'>, choices={'>', '>=', 'ge', 'gt'}, value=<class 'xclim.core.indicator._empty'>), 'ds': Parameter(kind=<InputKind.DATASET: 70>, default=None, compute_name=<class 'xclim.core.indicator._empty'>, description='A dataset with the variables given by name.', units=<class 'xclim.core.indicator._empty'>, choices=<class 'xclim.core.indicator._empty'>, value=<class 'xclim.core.indicator._empty'>)}, 'cf_attrs': [{'standard_name': 'number_of_days_with_air_temperature_above_threshold', 'long_name': 'Number of days with at least {window} consecutive days where the maximum daily temperature is above the {tasmax_per_thresh}th percentile(s)', 'units': 'days', 'cell_methods': 'time: sum over days', 'description': '{freq} number of days with at least {window} consecutive days where the maximum daily temperature is above the {tasmax_per_thresh}th percentile(s). A {tasmax_per_window} day(s) window, centred on each calendar day in the {tasmax_per_period} period, is used to compute the {tasmax_per_thresh}th percentile(s).', 'var_name': 'warm_spell_duration_index'}], 'call_info': {'xclim_function': 'warm_spell_duration_index', 'parameters': {'tasmax': 'tasmax', 'tasmax_per': 'tasmax_per', 'window': 6, 'freq': 'YS', 'resample_before_rl': True, 'bootstrap': False, 'op': '>', 'ds': <xarray.Dataset> Size: 242MB
Dimensions:      (time: 14610, lat: 48, lon: 84, percentiles: 1, dayofyear: 366)
Coordinates:
  * time         (time) datetime64[ns] 117kB 2015-01-01 ... 2054-12-31
  * lat          (lat) float64 384B 41.62 41.67 41.72 ... 43.87 43.92 43.97
  * lon          (lon) float64 672B -9.575 -9.525 -9.475 ... -5.475 -5.425
  * percentiles  (percentiles) int64 8B 90
  * dayofyear    (dayofyear) int64 3kB 1 2 3 4 5 6 7 ... 361 362 363 364 365 366
    height       float64 8B 2.0
Data variables:
    tasmax       (time, lat, lon) float32 236MB dask.array<chunksize=(4870, 16, 28), meta=np.ndarray>
    tasmax_per   (lat, lon, dayofyear, percentiles) float32 6MB dask.array<chunksize=(8, 14, 366, 1), meta=np.ndarray>
Attributes:
    model:         ACCESS-CM2_r1i1p1f1_deepESD
    scenario:      ssp585
    project_name:  cmip6
    project_type:  projections}}}}
[66]:
# HDD (Heating Degree Days)
print("HDD fields:")
print(hdd.ls())

print("\n HDD metadata:")
print(hdd.metadata()[0])

print("\n HDD xarray attributes:")
print(hdd.to_xarray().attrs)
HDD fields:
               variable level       valid_datetime   units
0   heating_degree_days  None  2015-01-01T00:00:00  K days
1   heating_degree_days  None  2016-01-01T00:00:00  K days
2   heating_degree_days  None  2017-01-01T00:00:00  K days
3   heating_degree_days  None  2018-01-01T00:00:00  K days
4   heating_degree_days  None  2019-01-01T00:00:00  K days
5   heating_degree_days  None  2020-01-01T00:00:00  K days
6   heating_degree_days  None  2021-01-01T00:00:00  K days
7   heating_degree_days  None  2022-01-01T00:00:00  K days
8   heating_degree_days  None  2023-01-01T00:00:00  K days
9   heating_degree_days  None  2024-01-01T00:00:00  K days
10  heating_degree_days  None  2025-01-01T00:00:00  K days
11  heating_degree_days  None  2026-01-01T00:00:00  K days
12  heating_degree_days  None  2027-01-01T00:00:00  K days
13  heating_degree_days  None  2028-01-01T00:00:00  K days
14  heating_degree_days  None  2029-01-01T00:00:00  K days
15  heating_degree_days  None  2030-01-01T00:00:00  K days
16  heating_degree_days  None  2031-01-01T00:00:00  K days
17  heating_degree_days  None  2032-01-01T00:00:00  K days
18  heating_degree_days  None  2033-01-01T00:00:00  K days
19  heating_degree_days  None  2034-01-01T00:00:00  K days
20  heating_degree_days  None  2035-01-01T00:00:00  K days
21  heating_degree_days  None  2036-01-01T00:00:00  K days
22  heating_degree_days  None  2037-01-01T00:00:00  K days
23  heating_degree_days  None  2038-01-01T00:00:00  K days
24  heating_degree_days  None  2039-01-01T00:00:00  K days
25  heating_degree_days  None  2040-01-01T00:00:00  K days
26  heating_degree_days  None  2041-01-01T00:00:00  K days
27  heating_degree_days  None  2042-01-01T00:00:00  K days
28  heating_degree_days  None  2043-01-01T00:00:00  K days
29  heating_degree_days  None  2044-01-01T00:00:00  K days
30  heating_degree_days  None  2045-01-01T00:00:00  K days
31  heating_degree_days  None  2046-01-01T00:00:00  K days
32  heating_degree_days  None  2047-01-01T00:00:00  K days
33  heating_degree_days  None  2048-01-01T00:00:00  K days
34  heating_degree_days  None  2049-01-01T00:00:00  K days
35  heating_degree_days  None  2050-01-01T00:00:00  K days
36  heating_degree_days  None  2051-01-01T00:00:00  K days
37  heating_degree_days  None  2052-01-01T00:00:00  K days
38  heating_degree_days  None  2053-01-01T00:00:00  K days
39  heating_degree_days  None  2054-01-01T00:00:00  K days

 HDD metadata:
XArrayMetadata({'units': 'K days', 'units_metadata': 'temperature: unknown', 'cell_methods': ' time: sum over days', 'history': "[2025-12-01 23:20:41] heating_degree_days: HEATING_DEGREE_DAYS(tas=tas, thresh='17.0 degC', freq='YS') with options check_missing=any - xclim version: 0.59.1\n", 'standard_name': 'integral_of_air_temperature_deficit_wrt_time', 'long_name': 'Cumulative sum of temperature degrees for mean daily temperature below 17.0 degc', 'description': 'Annual cumulative heating degree days (mean temperature below 17.0 degc).', 'date': 20150101, 'time': 0, 'variable': 'heating_degree_days', 'level': None, 'levtype': 'sfc'})

 HDD xarray attributes:
{'earthkit_provenance': {'earthkit_internal': {'input_type': 'earthkit.data.readers.netcdf.fieldlist.XArrayMultiFieldList'}, 'indicator_definition': {'tas': Parameter(kind=<InputKind.VARIABLE: 0>, default='tas', compute_name='tas', description='Mean daily temperature.', units='[temperature]', choices=<class 'xclim.core.indicator._empty'>, value=<class 'xclim.core.indicator._empty'>), 'thresh': Parameter(kind=<InputKind.QUANTIFIED: 2>, default='17.0 degC', compute_name='thresh', description='Threshold temperature on which to base evaluation.', units='[temperature]', choices=<class 'xclim.core.indicator._empty'>, value=<class 'xclim.core.indicator._empty'>), 'freq': Parameter(kind=<InputKind.FREQ_STR: 3>, default='YS', compute_name='freq', description='Resampling frequency.', units=<class 'xclim.core.indicator._empty'>, choices=<class 'xclim.core.indicator._empty'>, value=<class 'xclim.core.indicator._empty'>), 'ds': Parameter(kind=<InputKind.DATASET: 70>, default=None, compute_name=<class 'xclim.core.indicator._empty'>, description='A dataset with the variables given by name.', units=<class 'xclim.core.indicator._empty'>, choices=<class 'xclim.core.indicator._empty'>, value=<class 'xclim.core.indicator._empty'>), 'indexer': Parameter(kind=<InputKind.KWARGS: 50>, default=<class 'inspect._empty'>, compute_name=<class 'xclim.core.indicator._empty'>, description='Indexing parameters to compute the indicator on a temporal subset of the data. It accepts the same arguments as :py:func:`xclim.indices.generic.select_time`.', units=<class 'xclim.core.indicator._empty'>, choices=<class 'xclim.core.indicator._empty'>, value=<class 'xclim.core.indicator._empty'>)}, 'cf_attrs': [{'standard_name': 'integral_of_air_temperature_deficit_wrt_time', 'long_name': 'Cumulative sum of temperature degrees for mean daily temperature below {thresh}', 'units': 'K days', 'cell_methods': 'time: sum over days', 'description': '{freq} cumulative heating degree days (mean temperature below {thresh}).', 'var_name': 'heating_degree_days'}], 'call_info': {'xclim_function': 'heating_degree_days', 'parameters': {'tas': 'tas', 'thresh': '17.0 degC', 'freq': 'YS', 'ds': <xarray.Dataset> Size: 707MB
Dimensions:  (time: 14610, lat: 48, lon: 84)
Coordinates:
  * time     (time) datetime64[ns] 117kB 2015-01-01 2015-01-02 ... 2054-12-31
  * lat      (lat) float64 384B 41.62 41.67 41.72 41.77 ... 43.87 43.92 43.97
  * lon      (lon) float64 672B -9.575 -9.525 -9.475 ... -5.525 -5.475 -5.425
    height   float64 8B 2.0
Data variables:
    tasmax   (time, lat, lon) float32 236MB dask.array<chunksize=(4870, 16, 28), meta=np.ndarray>
    tasmin   (time, lat, lon) float32 236MB dask.array<chunksize=(4870, 16, 28), meta=np.ndarray>
    tas      (time, lat, lon) float32 236MB dask.array<chunksize=(4870, 16, 28), meta=np.ndarray>
Attributes:
    model:         ACCESS-CM2_r1i1p1f1_deepESD
    scenario:      ssp585
    project_name:  cmip6
    project_type:  projections, 'indexer': {}}}}}
Notes on HDD
The Heating Degree Days index estimates heating demand based on temperatures below a threshold (typically 18 °C).
Metadata document the base temperature, frequency of accumulation, and calculation method (approximation).
HDD is a valuable indicator for energy and climate impact assessments.
[67]:
# Define domain (Spain north coast)
domain = [-9.6, -5.4, 41.6, 44.0]

# Create figure: 1 row (2 indices) × 2 scenarios (historical + ssp585)
figure = ekp.Figure(
    crs=ccrs.NearsidePerspective(central_longitude=-5, central_latitude=43), rows=1, columns=3, size=(15, 6)
)

# Define indices and corresponding datasets
indices = {"DTR": dtr, "WSDI": wsdi, "HDD": hdd}

# Define color maps for each index
cmaps = {"DTR": "autumn_r", "WSDI": "autumn_r", "HDD": "autumn_r"}

units = {"DTR": "K", "WSDI": "days", "HDD": "K days"}

# PLOT: Each index climatology
for col, (name, index_obj) in enumerate(indices.items()):
    ds = index_obj.to_xarray().mean("time")
    cmap = cmaps[name]

    style = ekp.styles.Style(colors=cmap, units=units[name])
    map_plot = figure.add_map(row=0, column=col, domain=domain)
    map_plot.quickplot(ds, style=style)
    map_plot.coastlines()
    map_plot.gridlines()
    map_plot.title(f"{name} Climatology (SSP585)")
    map_plot.legend(location="right")

figure.show()